Case study · 3-min skim
Kompmodo
From a comparison-table brief to a v2 the owners bought.
Kompmodo helps listing agents price a home against recent sales. The owners asked me for help with the comparison table. Analyzing the problem showed where agents really lost time, so I designed and built v2 around it, table redesign included, then shipped it with the engineer who built v1.
- Product
- UX & UI
- Brand
- Marketing site
- Frontend + backend, with an engineer
Demo data: fictional listings, agent and market.
Summary
- Role
- Product, UX & UI, brand and marketing site. I built the front and back end with coding agents until summer 2026; the interface is entirely mine.
- Team
- The owners, and the engineer who built v1. I consulted him from day one; from summer 2026 he optimized the backend and wrote the migration that moved v1 users over. From 14 Sep 2026 we reviewed each other's pull requests.
- Timeline
- Mar – Oct 2026
- Tools
- Claude Code · Codex · PostHog analytics and replays · CI with lint, typecheck and tests
- Outcome
- v2 is live, v1 users moved over through the engineer's migration, and the owners bought the v2 IP. The comparison table they first asked about is one step of the new five-step flow.
- the comparison table, now one step of five
- 1 → 5the comparison table, now one step of fivesubject · compare · market · report · share
- app, online report and PDF
- EN · ESapp, online report and PDFas of Oct 2026
- report themes built, then kept
- 7 → 3report themes built, then keptprofessional · luxury · legacy
The brief
Started with the table. Mapped the whole pricing job.
The ask
- 01SubjectThe home being priced
- 02CompareComps, adjusted in ModoMatrix
- 03MarketModoVision market charts
- 04ReportBranded pages, two languages
- 05ShareA link, a QR code, a PDF
What v1 made agents do
Pricing a home meant leaving the app.
- Find homes Search the MLS in another tab Map search with drawn areas
- See them Photos only on the MLS site A gallery next to every comp
- Keep work Saving meant a full save and export Every edit saves itself
- Send it A slow PDF, rendered on a server A link first, a PDF from the browser
- Data Two MLS sources One adapter per MLS, built to grow
Key decisions
Three choices, and what I set aside.
- 01
Design and build a working v2, with the table redesign inside it.
- Set aside
- A clickable prototype of the comparison table alone.
- Why
- Analyzing the problem showed where agents lost time: searching the MLS and viewing photos in other tabs, slow server-rendered PDFs, and only two MLS sources. Building Pandough with coding agents had shown me I could deliver a working product.
- 02
Keep v1's table, row order, terms and adjustment logic.
- Set aside
- A clean-slate redesign of the grid.
- Why
- v1 had paying agents. Nothing they knew had to be relearned, and the adjustment schedule reproduces v1's numbers.
- 03
Make the report a link first and print the PDF from the browser.
- Set aside
- v1's PDF, rendered on a server.
- Why
- The server PDF was slow. A link opens on the seller's phone, and the PDF prints from the same pages.
What I kept
New tool, same habits.
v1 had paying agents. Nothing they knew had to be relearned.
Kept from v1
- The CMA table and its adjustment logic
- v1's row order and the agents' own terms
- An adjustment schedule that reproduces v1's numbers
- A Legacy theme and a compact, v1-style mode
- Old report links still open
Added around it
- + Map search
- + Photo galleries
- + Comp Fit auto-comps
- + ModoVision charts
- + Online report
- + Spanish
The product
One flow, from address to shared report.
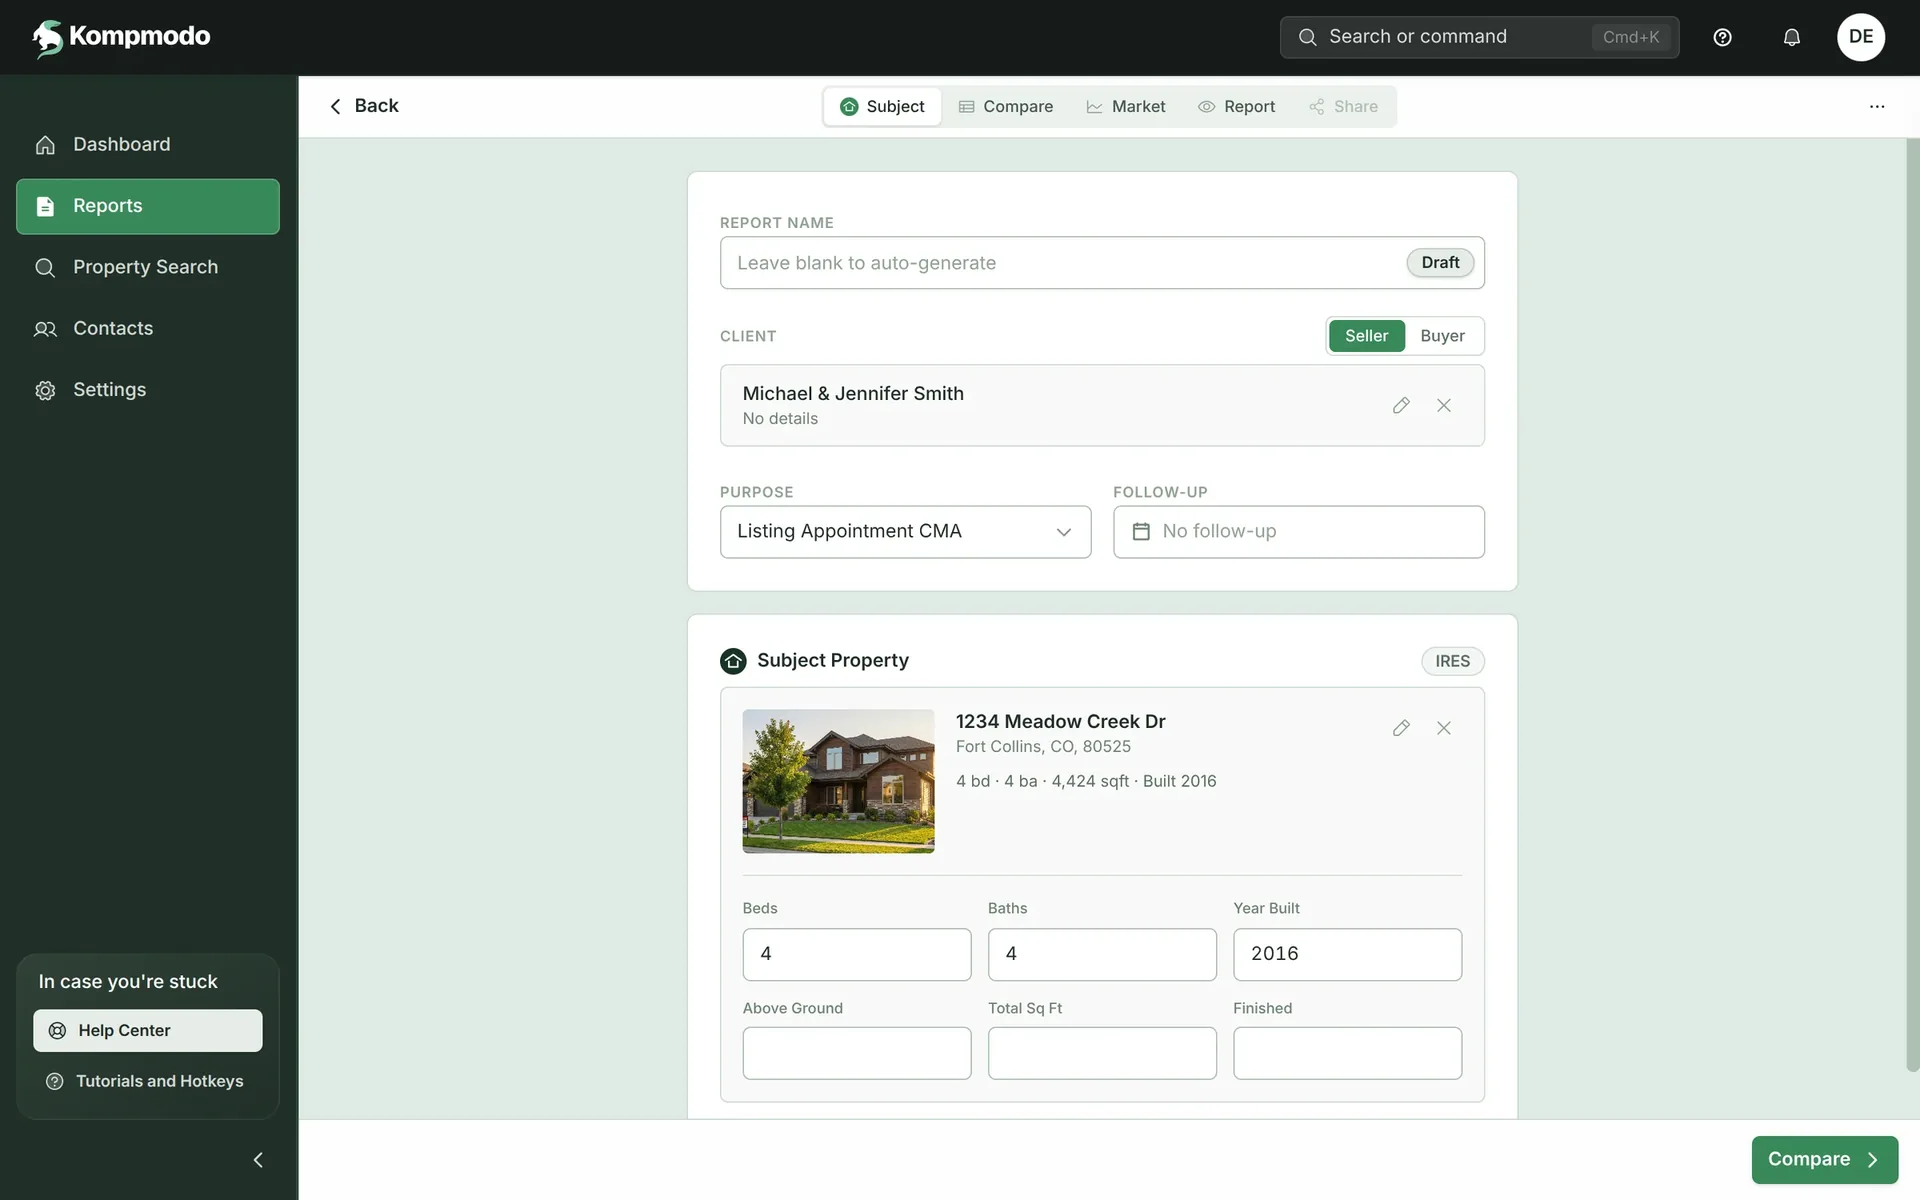
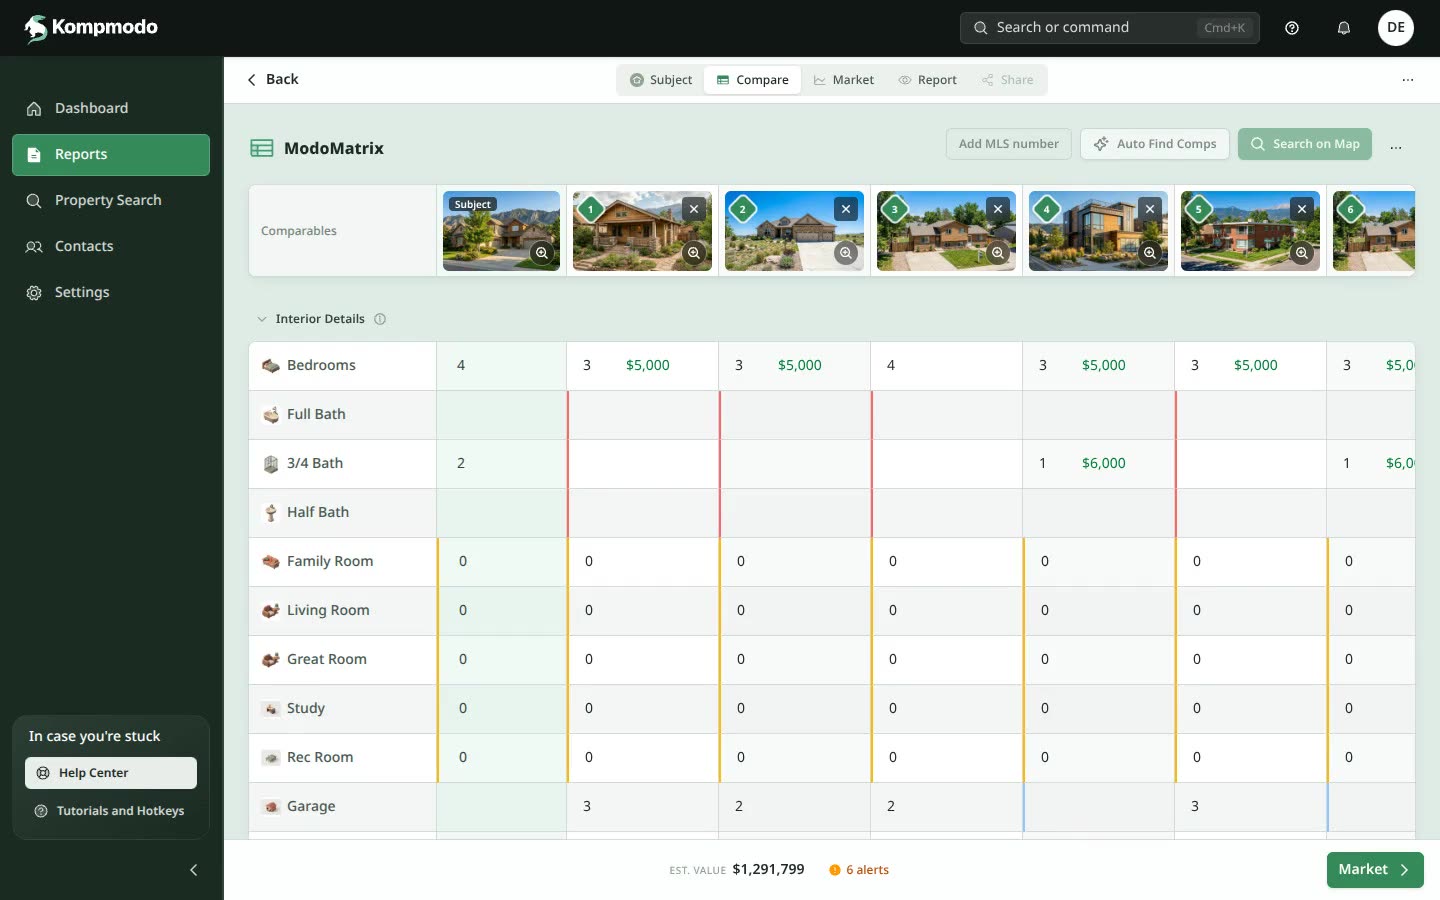
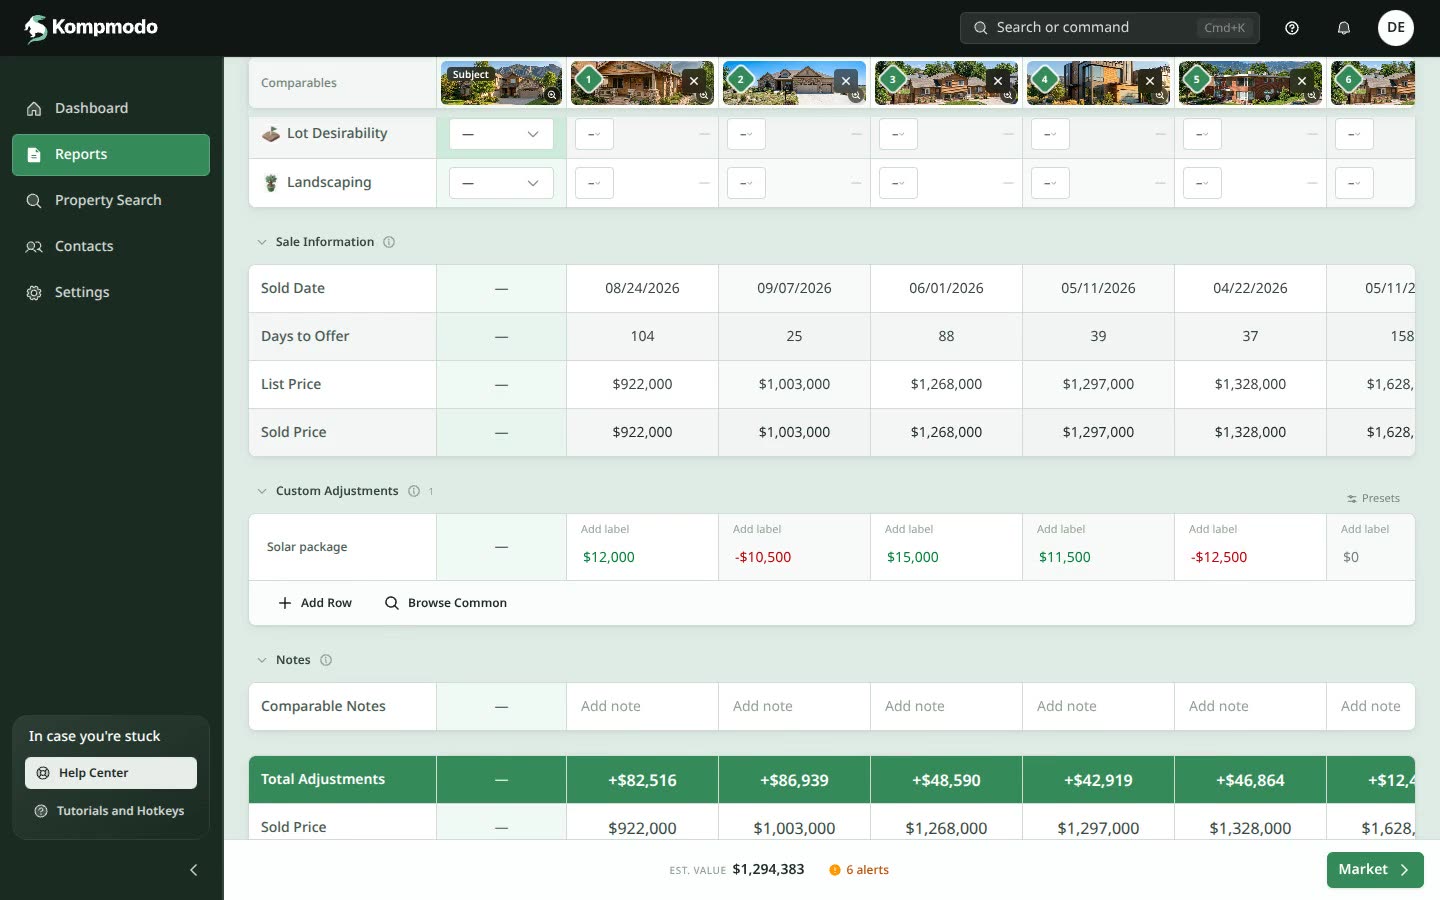
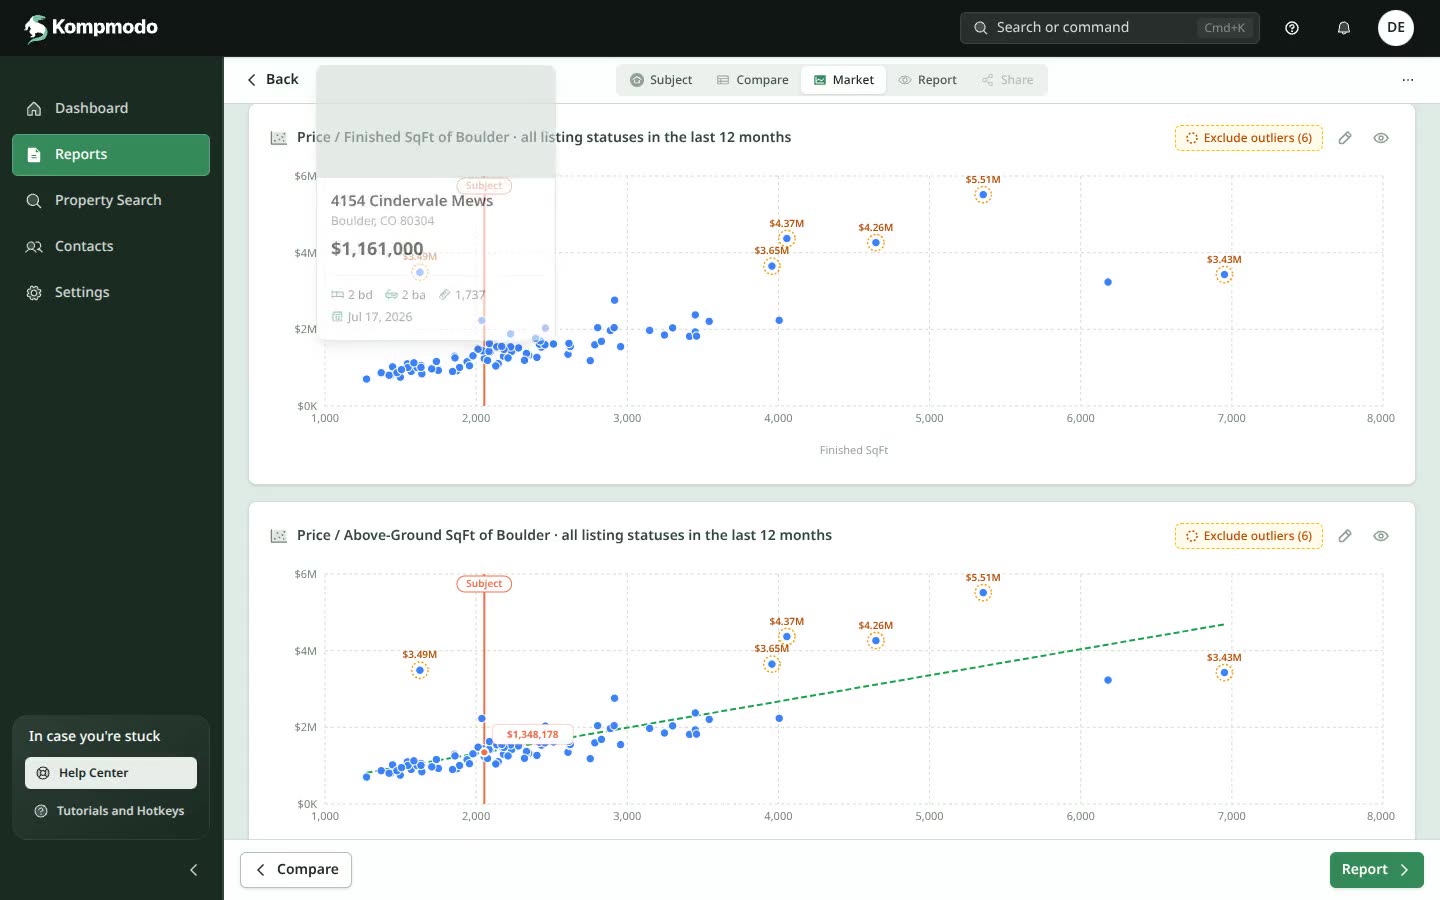
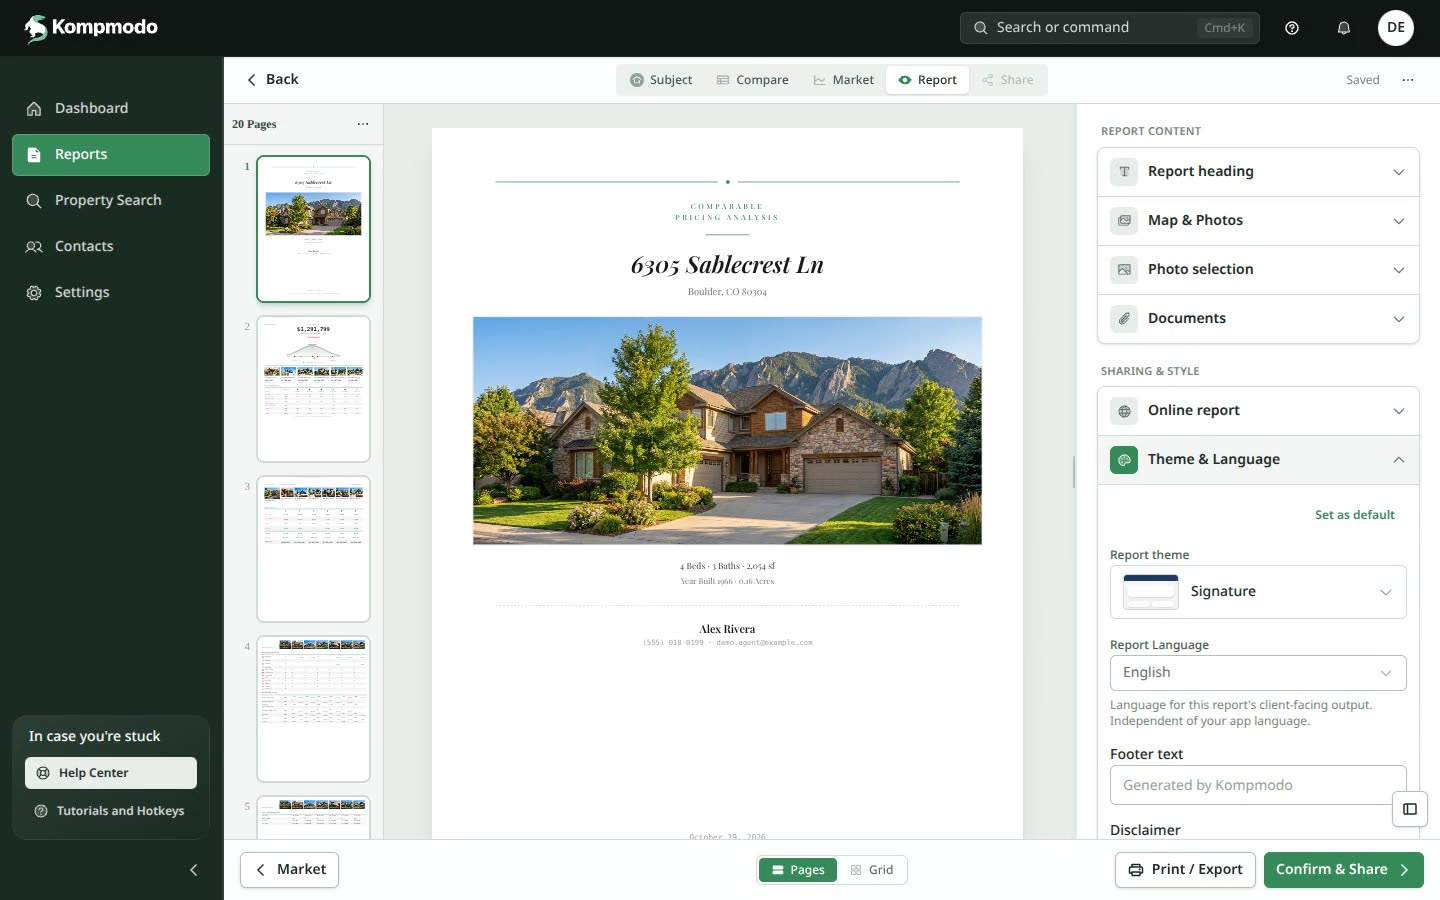
06 Share
Demo data throughout: fictional listings, agent and market.
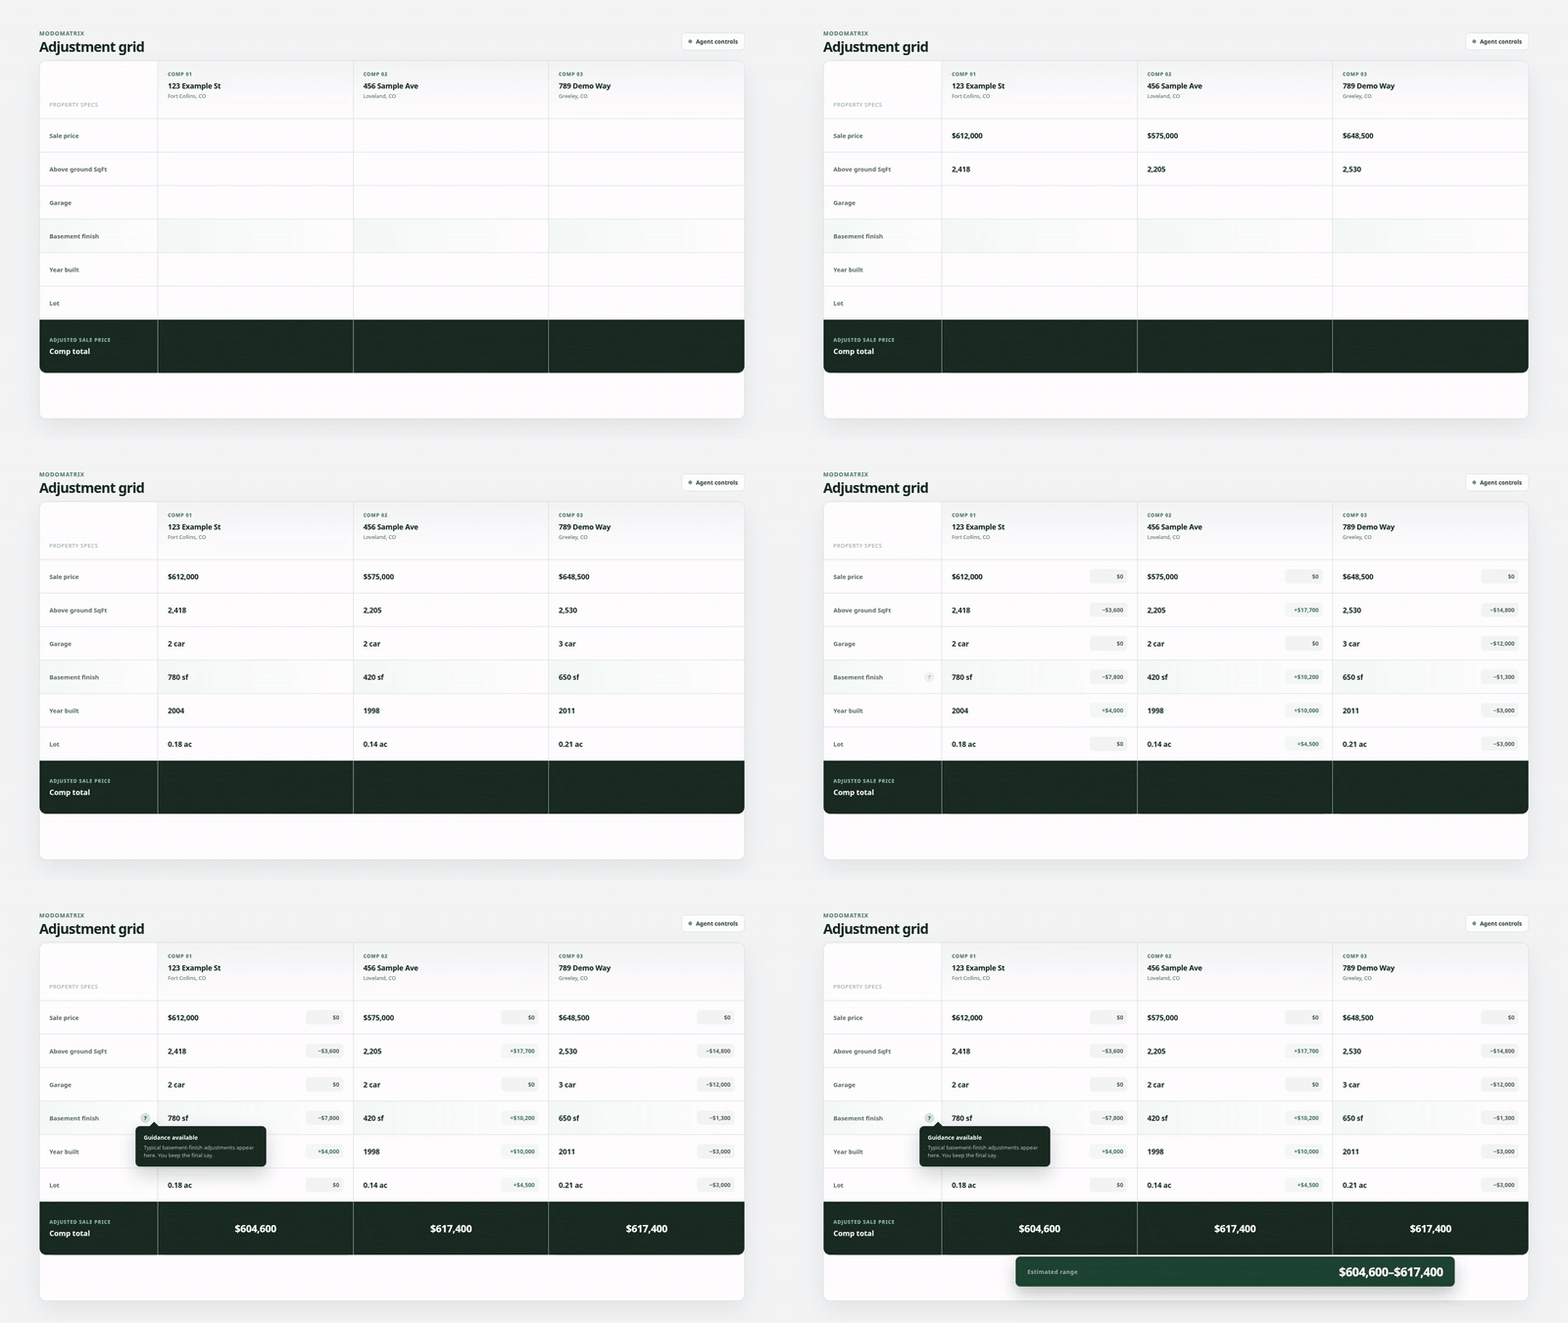
ModoMatrix
Dense data, decided cell by cell.
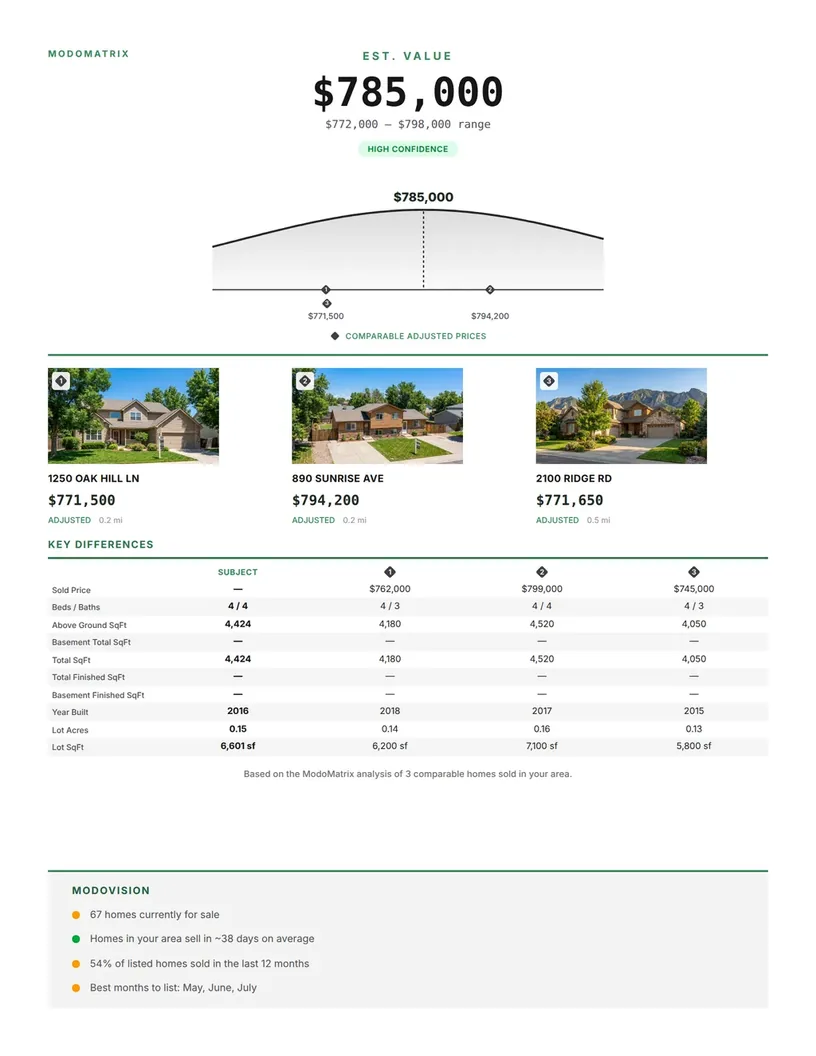
“Flip the axes so I can see where my home sits.”
Kept the axes, added a shaded typical range around the trend line.
It answers the question without changing a number the report claims.
“$0 in every cell reads like we adjusted and got nothing.”
Rows with no adjustment stay blank. A real $0 still shows.
Blank means not adjusted, zero means adjusted to zero.
Agents fill one feature across every comp, then the next.
Tab walks across the row, not down the column.
The grid follows the agent, not the spreadsheet.
From agents' feedback in the v2 tracker, Jul – Aug 2026.
ModoVision
Market charts a seller can follow.
Delivery
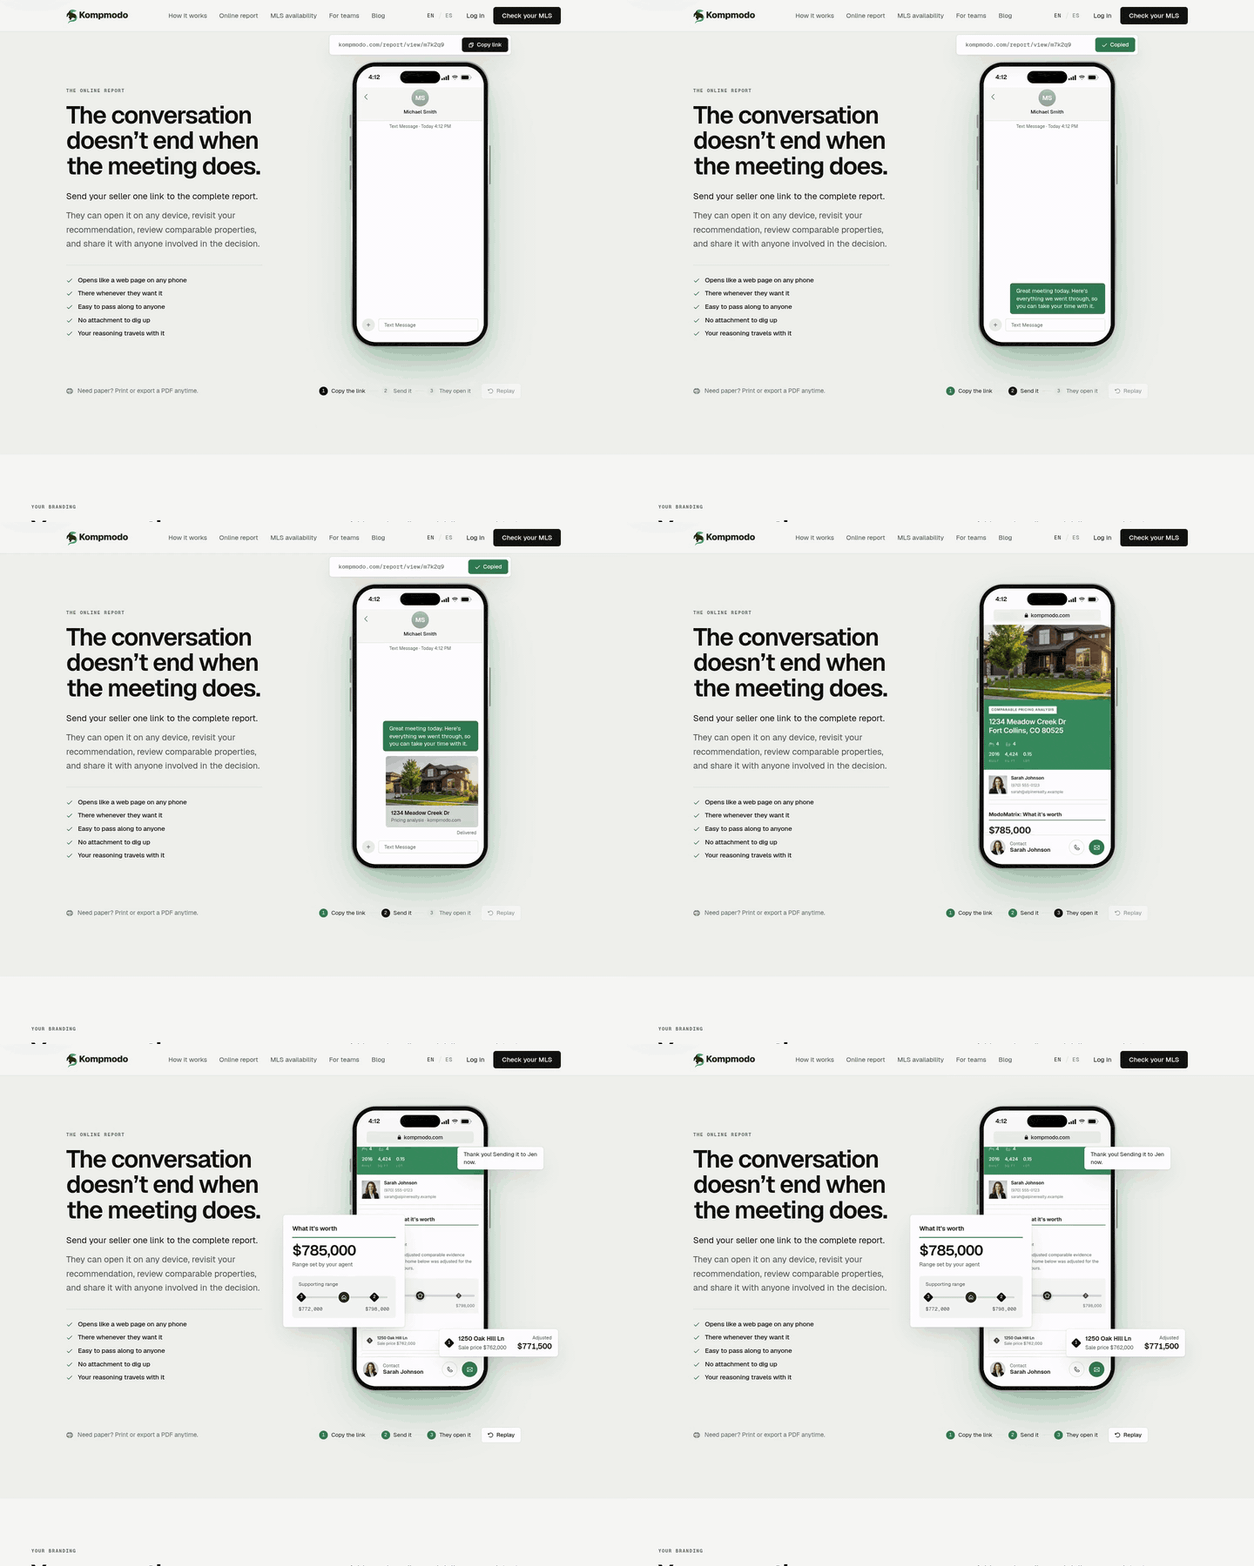
A report is a link first, a PDF second.
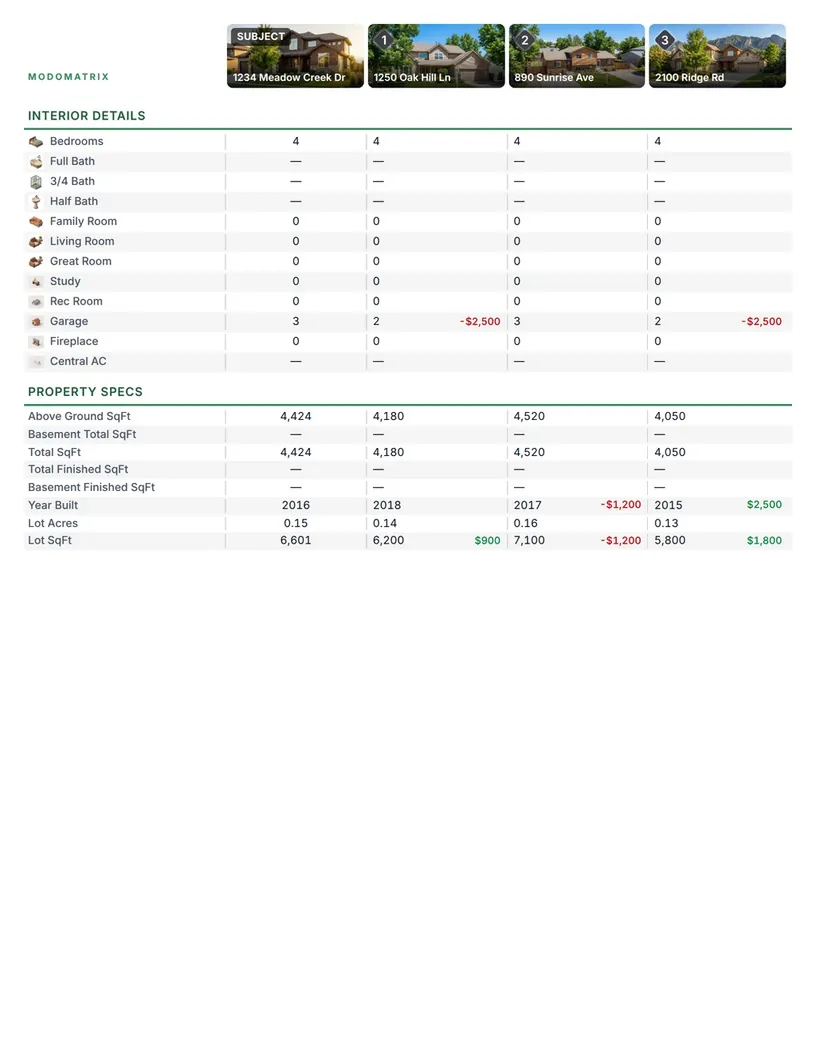

- Online reportOpens on the seller's phone
- QR codePrinted on the cover
- PDFPrinted by the browser, from the same pages
Data
Every MLS speaks its own dialect.
I designed the first structure. The engineer improved it and the data model.
- IRESNorthern Colorado · live
- PPARPikes Peak · next
- Next MLSone adapter each
One listing model
- Statuses
- Property types
- Square feet
- Photos
- Rooms & specs
- Search
- ModoMatrix
- ModoVision
- Report
Working with one engineer
Built alone, then shipped as a pair.
I was consulting the engineer from day one. We decided on the tech stack and a workflow that separates both versions cleanly. I built the interface alone; he later optimized the backend and wrote a migration that moved v1 users over, so it was a very smooth migration.
Commits to main, by month
Me
- Product & UX
- App & report UI
- Design system
- Marketing site
- Spanish
- Performance
The engineer
- CI & migrations
- Photo storage & MLS photo harvest
- Staging
- Module boundaries
- Admin tools
How we shipped, from 14 Sep 2026
- Branch off main
- PR preview
- The other one reviews
- CI green
- Merge to deploy
- Secret scan
- Lint
- Typecheck
- 396 test files
- Build
- PostHog analytics & replays
- Error boundaries
- EN · ES everywhere
- Staging
Brand
A new brand, from the mark to the report cover.

Seven report themes built. Three kept.
Professional
Luxury
Modern
Stylish
Geometric
Go to market
A marketing site in two languages.
How I work with AI
I designed the product, directed coding agents (Claude, Codex) for most of the build, and reviewed and tested what they wrote. From September the engineer and I reviewed each other's PRs.
Kompmodo is the whole arc: a clear brief, an analysis of where agents lost time, a product the owners bought, and a clean handover to an engineer. I want to do that inside a team.